StackSaga Cloud-Window
Overview
Stacksaga Cloud-Window is the platform that you can see the transaction tracing details of the transaction that you made in graphically.
Stacksaga cloud window provides the following features currently.
-
User management for securing the data in your event store.
-
Transaction tracing details chart.
User management
To show the transaction tracing details from your target service’s event-store database, the data is accessed through the endpoints that stacksaga-starter provides. By default, the endpoints are disabled (if you don’t want to see the tracing details). But in the real world, you want to see the transaction details most of the time in the development environment and also in the production. Then you have to enable the endpoints, and then the endpoints are exposed. but don’t worry, the Stacksaga framework will take care of that for you with the help of Cloud-Window APIs internally. you only need to enable the endpoints and configure your access details. (here you can see how the Stacksaga Cloud-Window accesses the Stacksaga framework’s endpoints by protecting)
Those endpoints are protected with the StackSaga Cloud-Window API internally.
The following steps should be completed to access your data.
-
Go to the StackSaga Cloud-Window and login with your Github account.
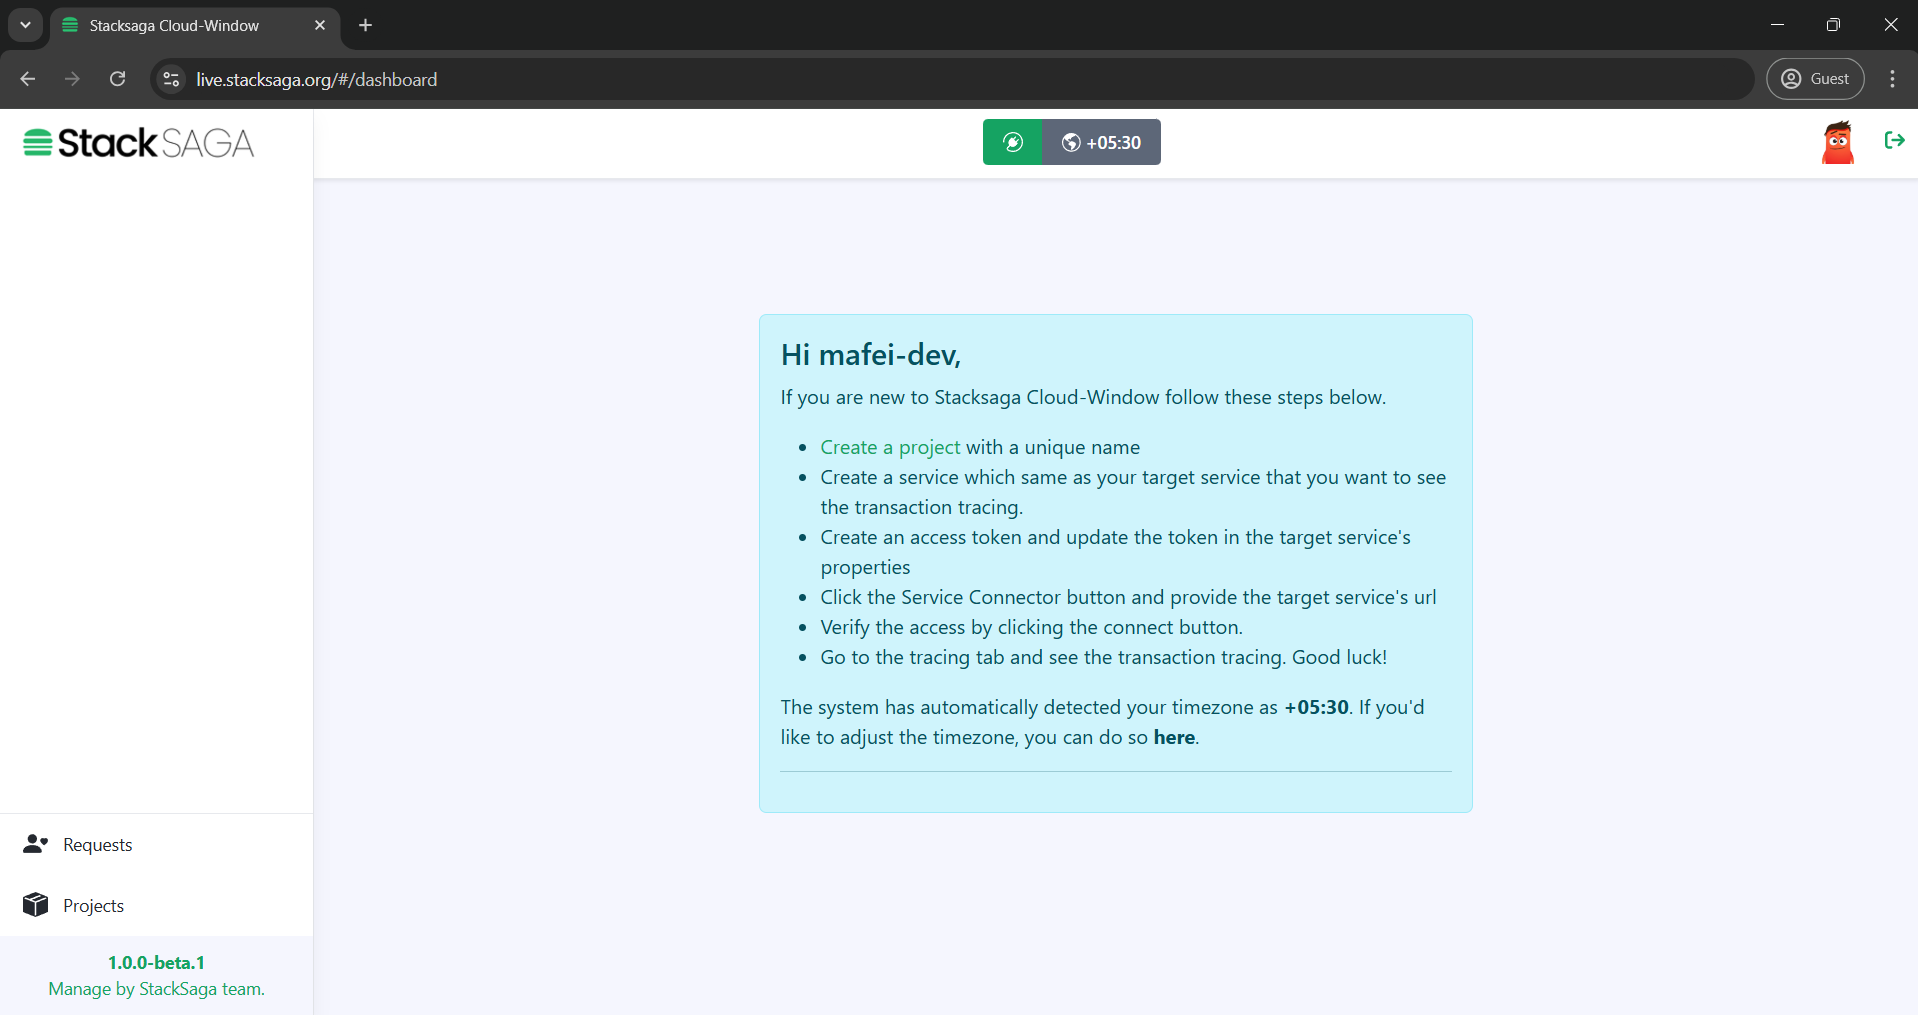
-
Create a project
A unique name should be provided to create a project.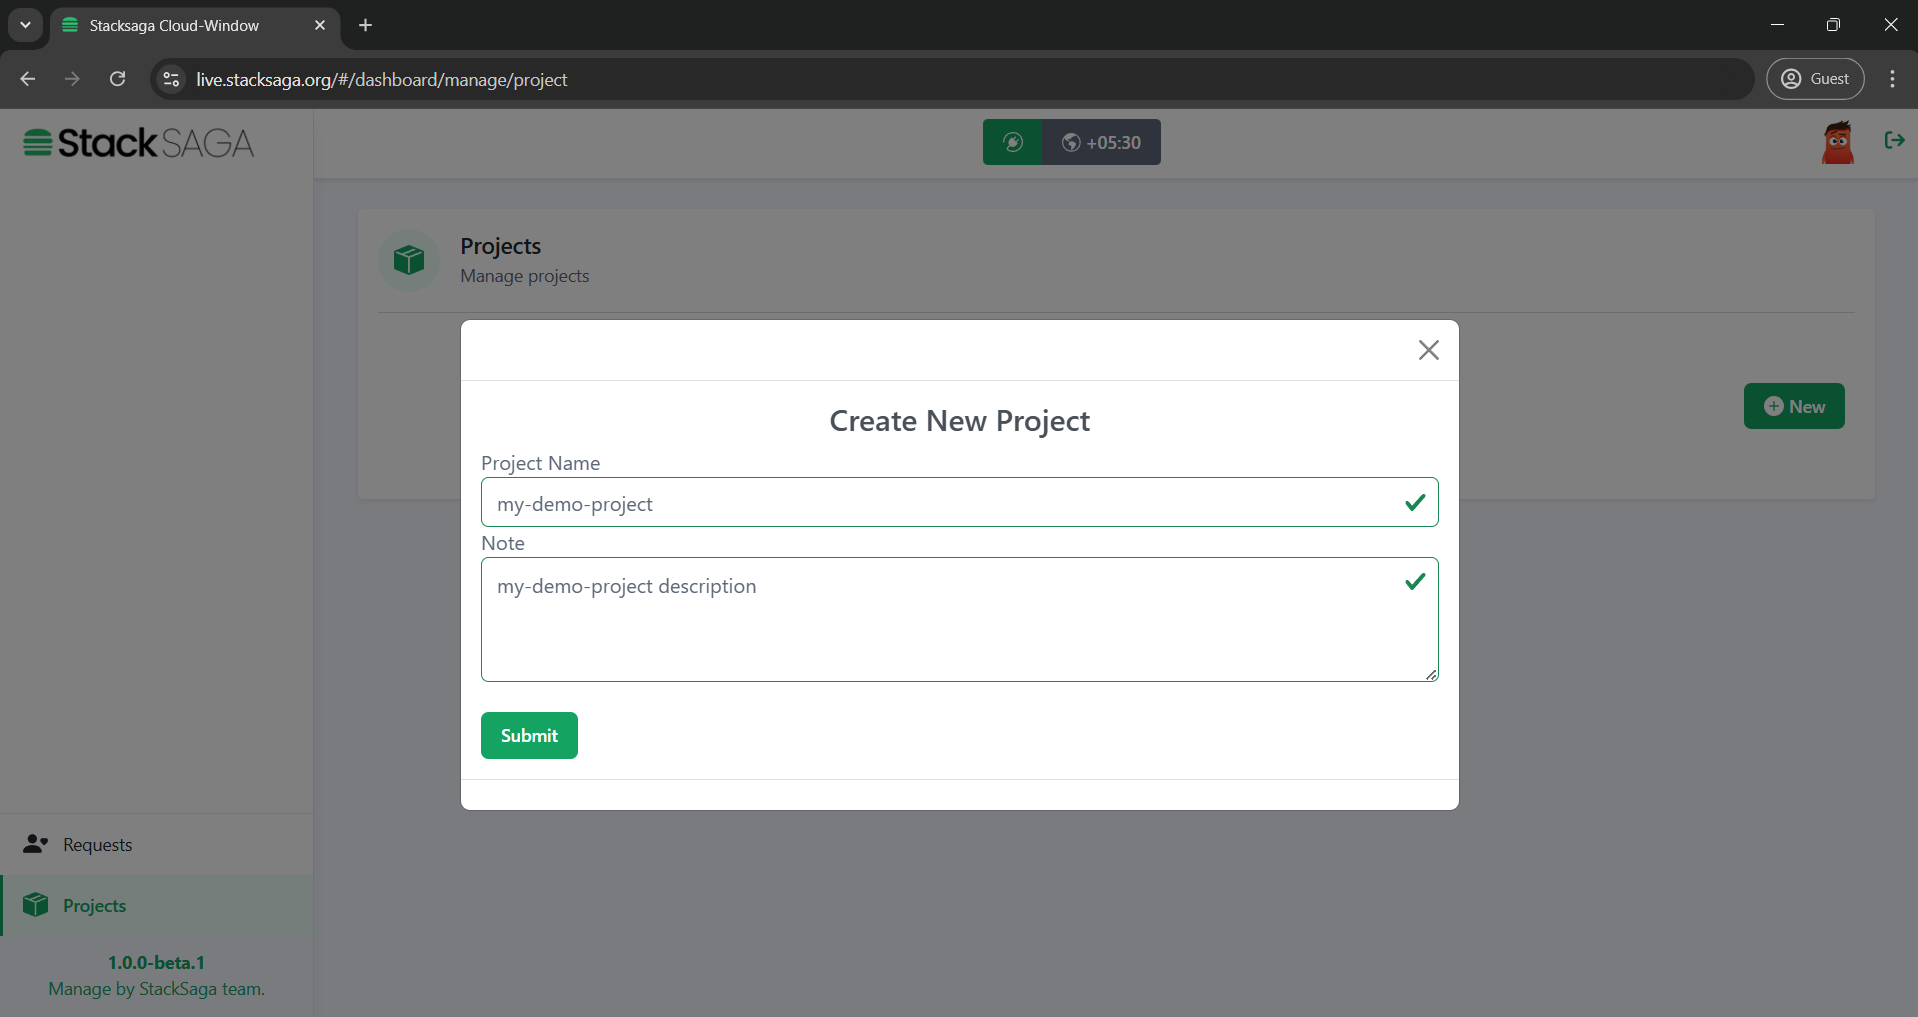
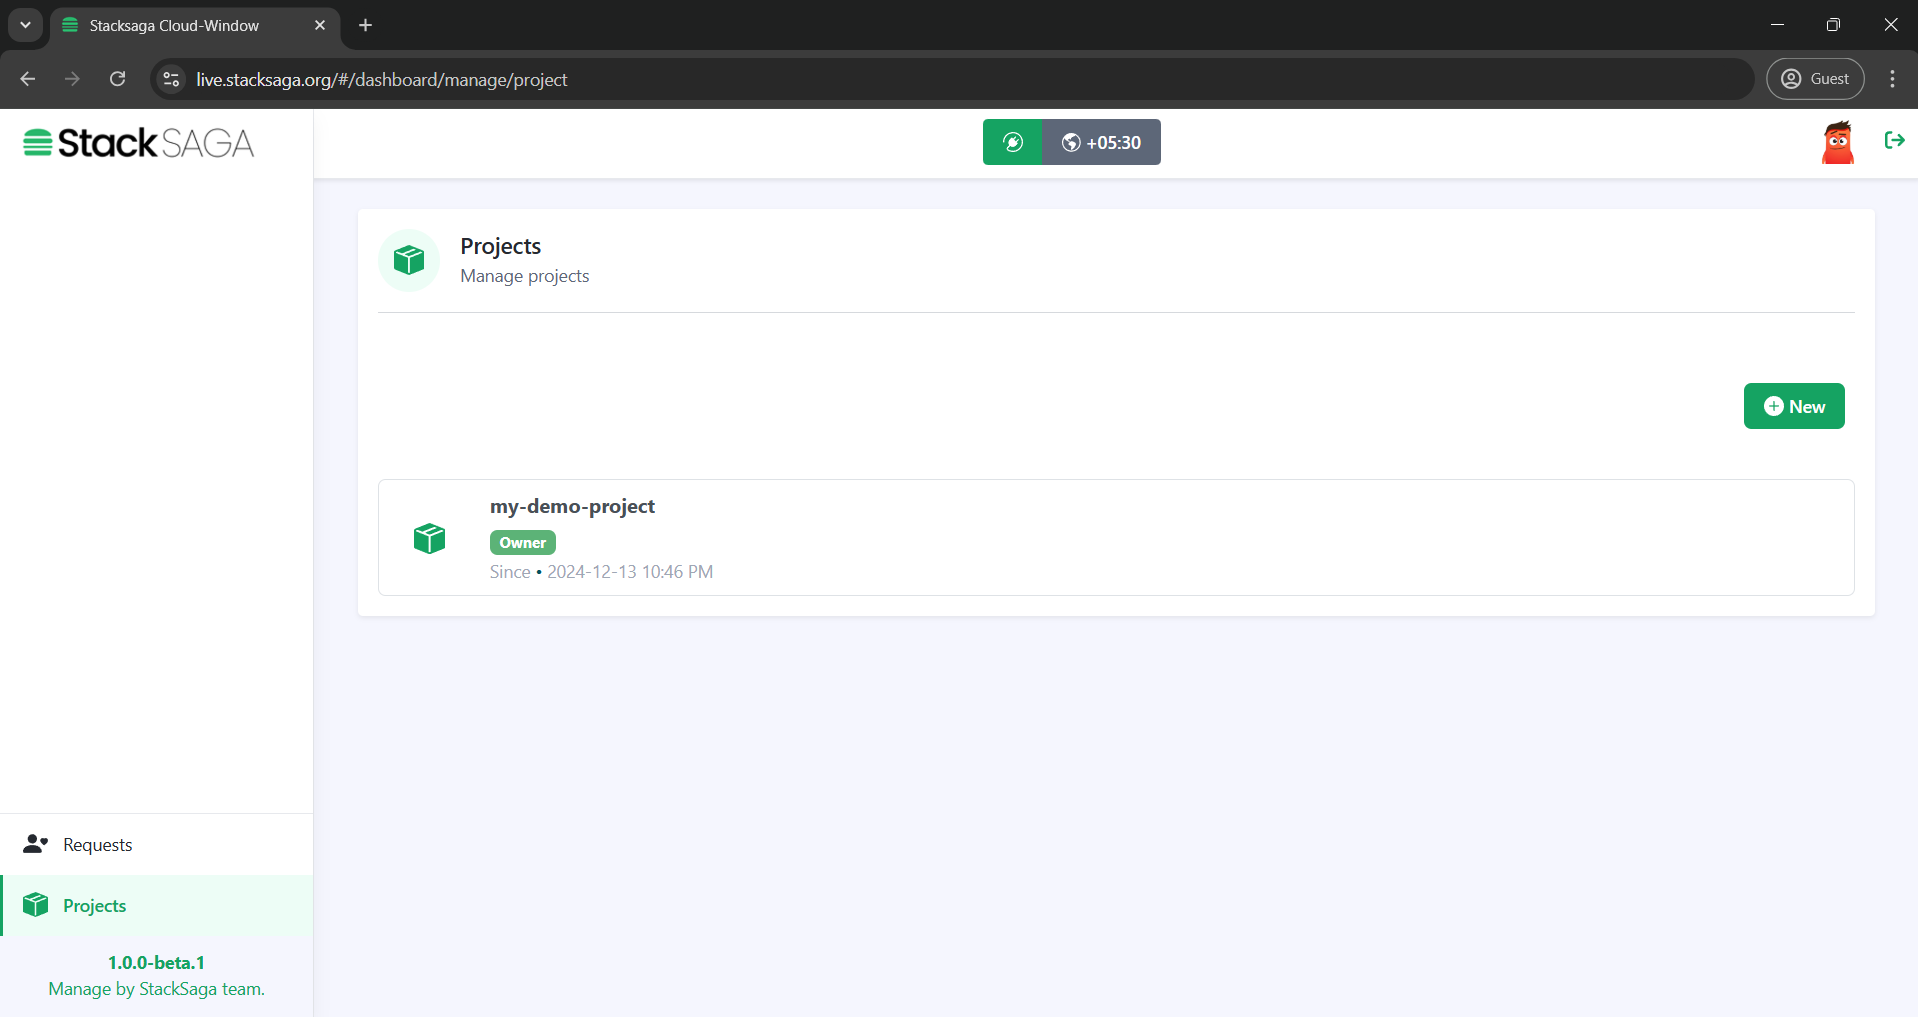
Then you will be able to see the project like below in the dashboard.
-
Create a service
you can create a service under the project that you have created recently. The service name should be exactly the same for the service name that you want to see the transaction tracing data. For instance, if you want to see the transaction details of the order-service, you have to create a service as it is.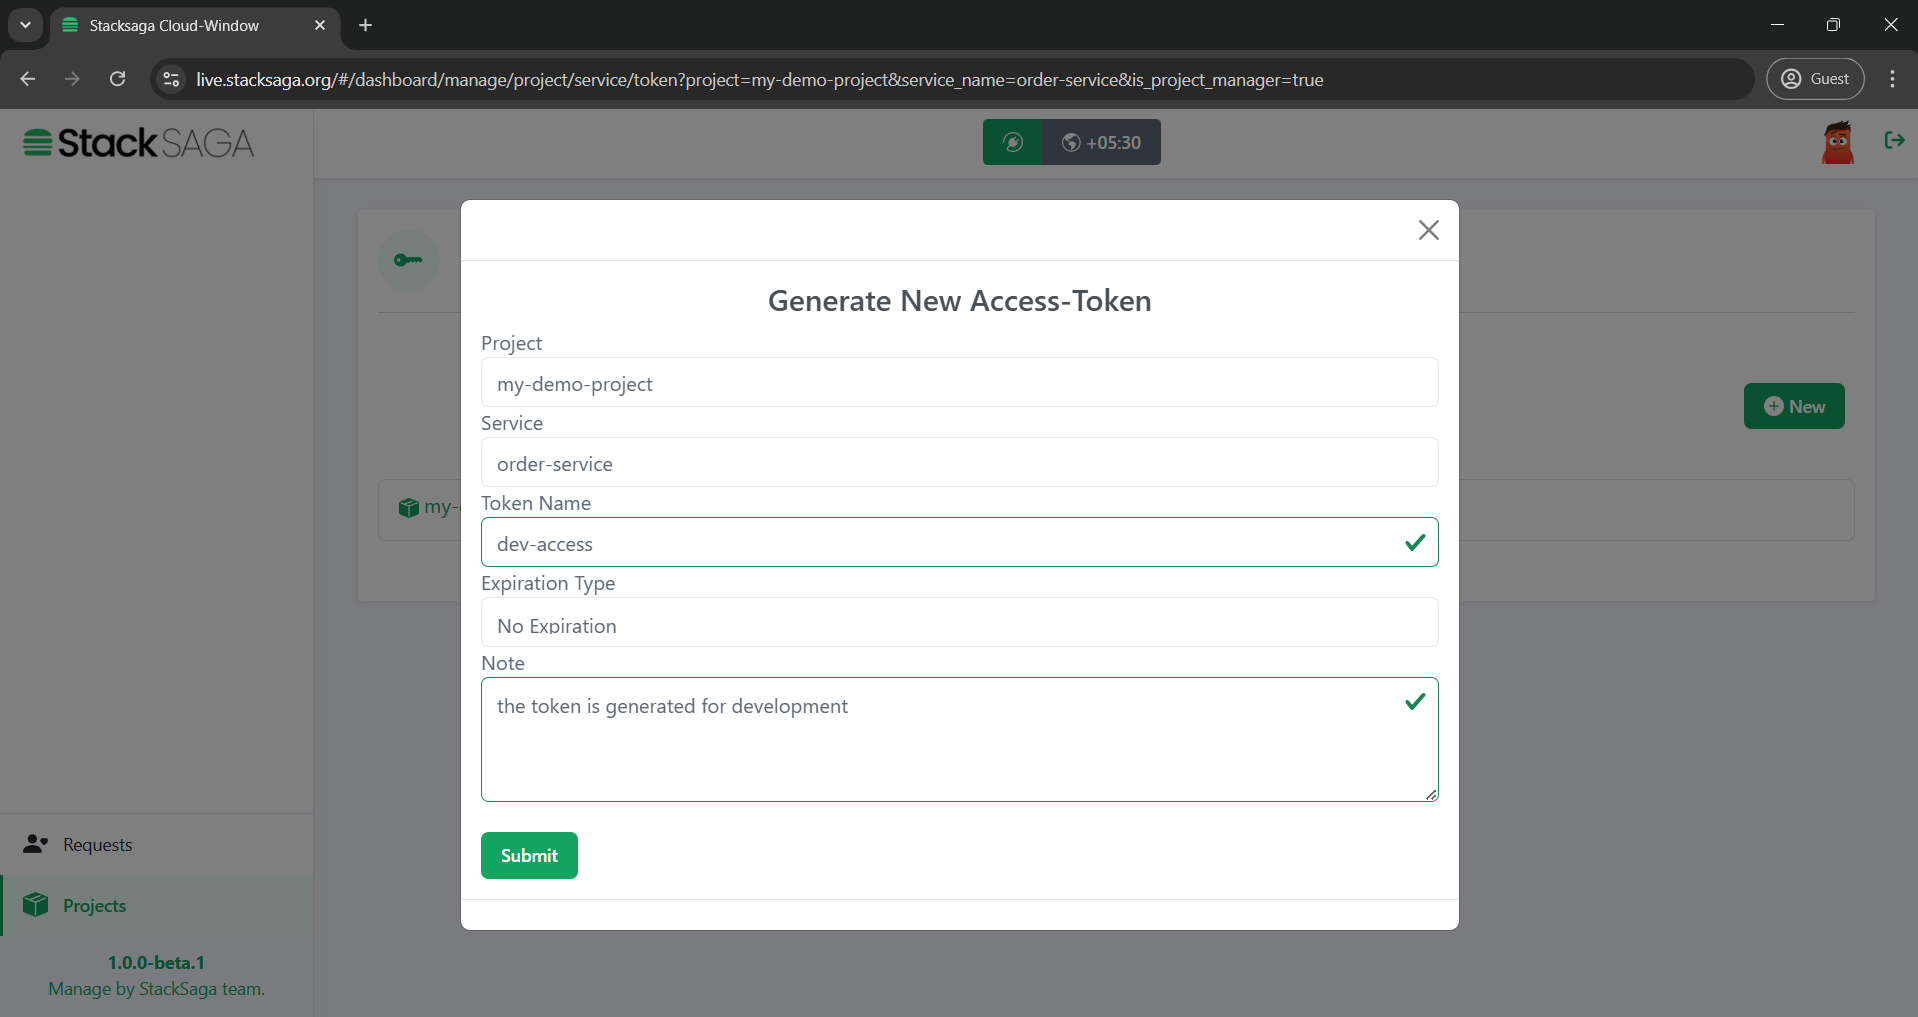
Then you will be able to see the service like below in the dashboard.
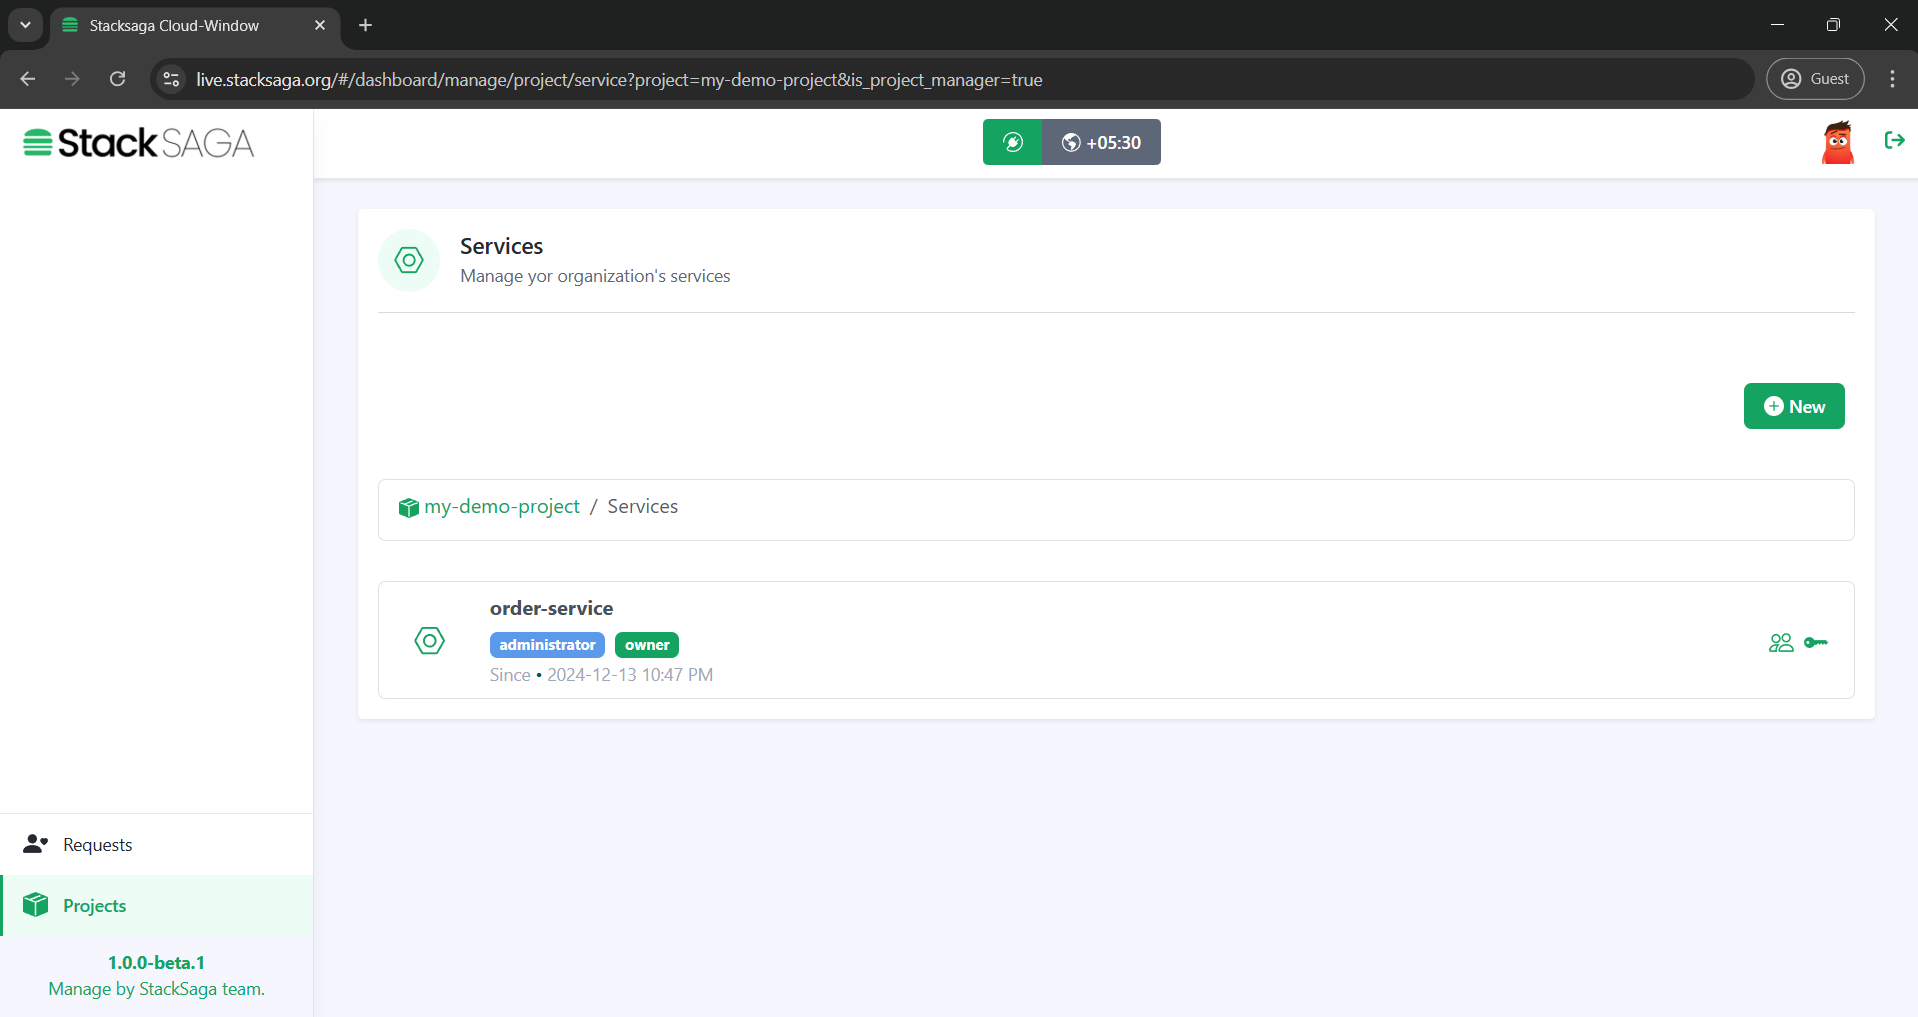
-
Create access-token for the service
You have to create an access token for the service that you want to see the transaction tracing data. The token is used in your application (order-service application,) and it ensures that the tracing details can be accessed by only the users (Owner, and Invited users) that are part of the service (owner or invited-users) under the service that you created.
The token can be created with no-expiration time or with an expiration time. After creating, make sure to copy the access token and use it in secret.
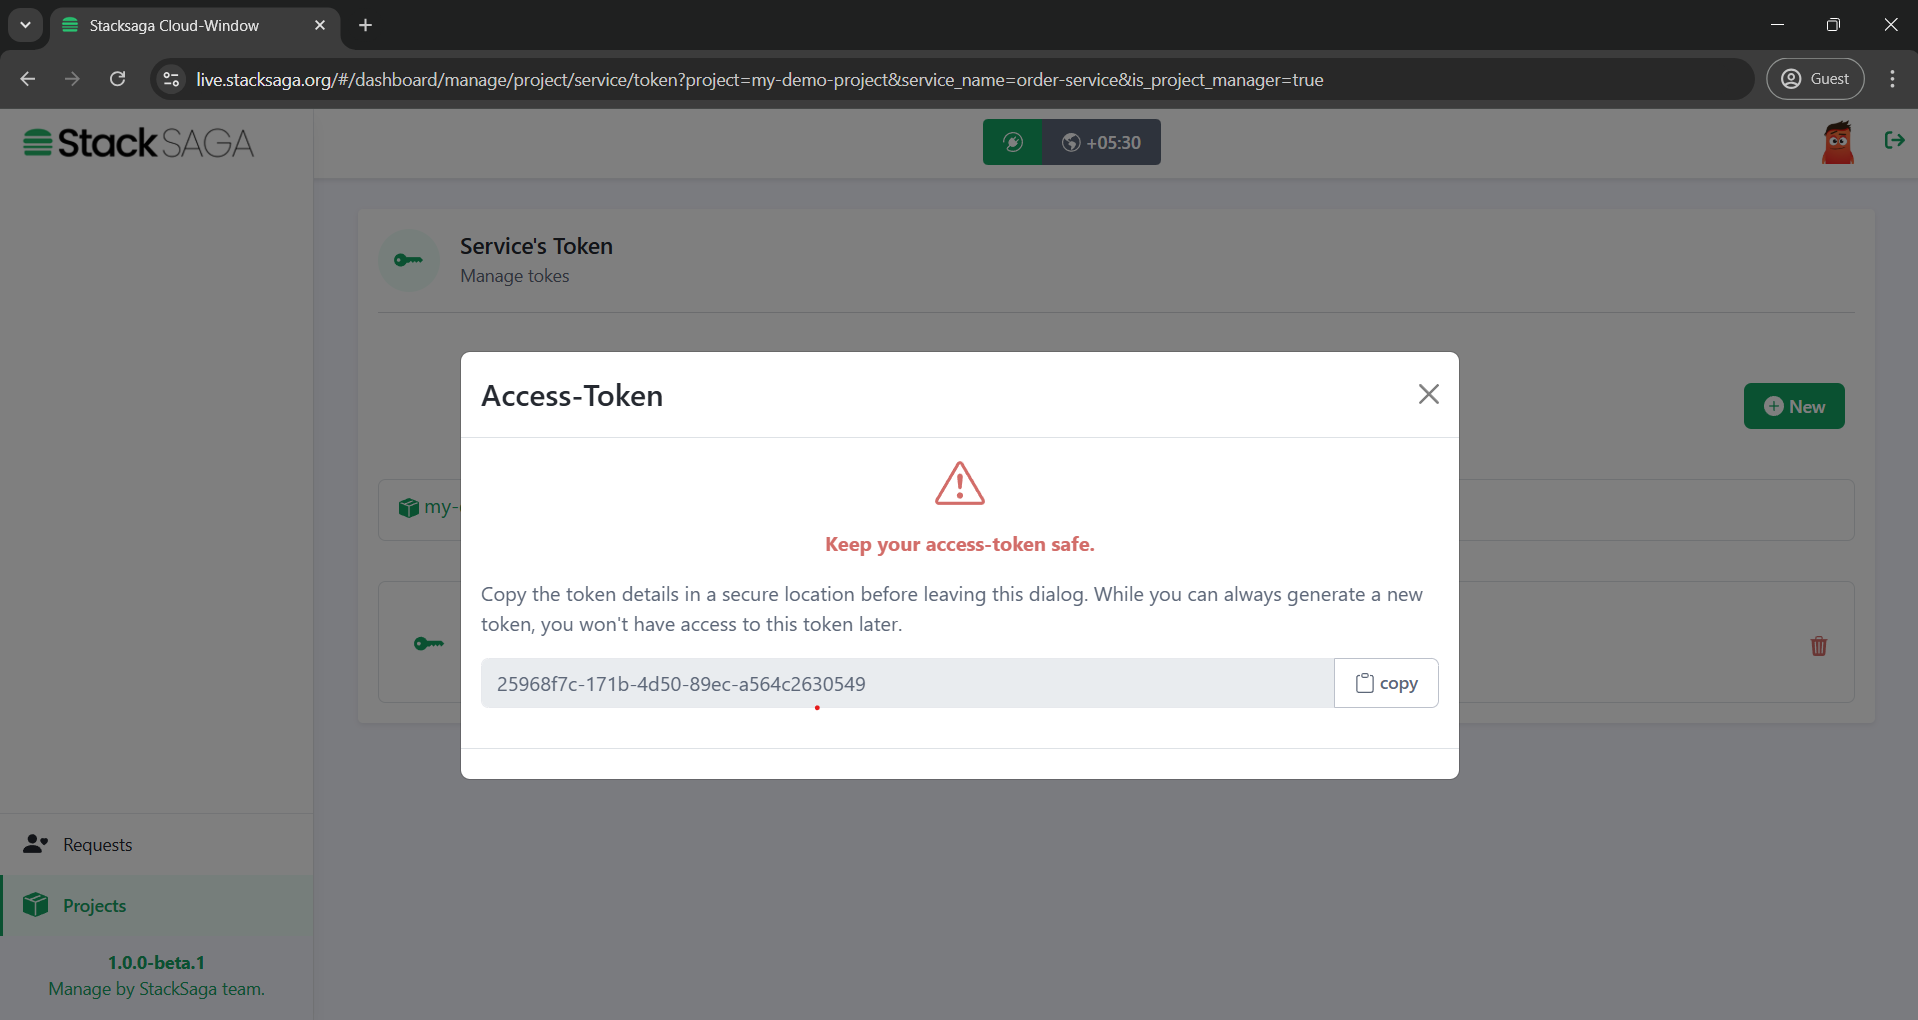
One project can have many operators as you need. If you would like to invite another user to act as a service-operator (To see the transaction details), you can invite them by mentioning the username of the user under the manage-operators. and also you can remove the added users into the services any time you want. -
update the token in the target application’s property file.
application.propertiesstacksaga.cloud-window.access-token=04949811-7be5-427f-8a80-57a26592493f #enable stacksaga APIs stacksaga.cloud-window.enable-api=true #enable stacksaga API security with the access token stacksaga.cloud-window.enable-api-filtering=true spring.application.name=order-service
StackSaga Admin is the monitoring dashboard of the StackSaga framework. It consists of UI dashboard as well as the backend server.
Involvement of StackSaga Cloud-Window in the StackSaga ecosystem.
To have a better understanding, let’s have look how the involvement of StackSaga Admin in the ecosystem.
Let’s see how the user’s access control and service’s access control are used. You know that Stacksaga framework saves the transaction data on the separate databases called event store. It can either one event-store for all utility services, or most probably it could be a separate individual event-store for each utility service. These are the data that you can access through the Stacksaga admin dashboard. That means the showing data in the admin dashboard are in coming from the Stacksaga admin sever' database. To access the data from each and individual event-store Stacksaga, provides inbuilt rest endpoints internally. Then let’s see how the connection is established between the admin and available services. You know how you can access your server in the microservice architecture by using a reverse proxy server like spring cloud API gateway. As an example, if you want to access your order service, you can access it by using the api gateway like this.
-
Format: {host:port}/{service-name| URL-alias}/{rest-path}
Stacksaga also follows this way to access the target service to fetch the data from the admin dashboard with the Stacksaga in-built endpoints. As an example, If you want to see the transaction data from the order-service, you have to provide the root url and the target service.
- Format
-
-
{host:port}/{service-name| URL-alias}/{rest-path}
-
- Samples
Before accessing the transaction data in the Stacksaga-admin, you have to save your current target service by checking the validity. In the middle of the dashboard (after successfully login to the dashboard), there is a plugin icon and then a popup will be open the connectivity window like below.
Validate Your Target Service’s Connectivity
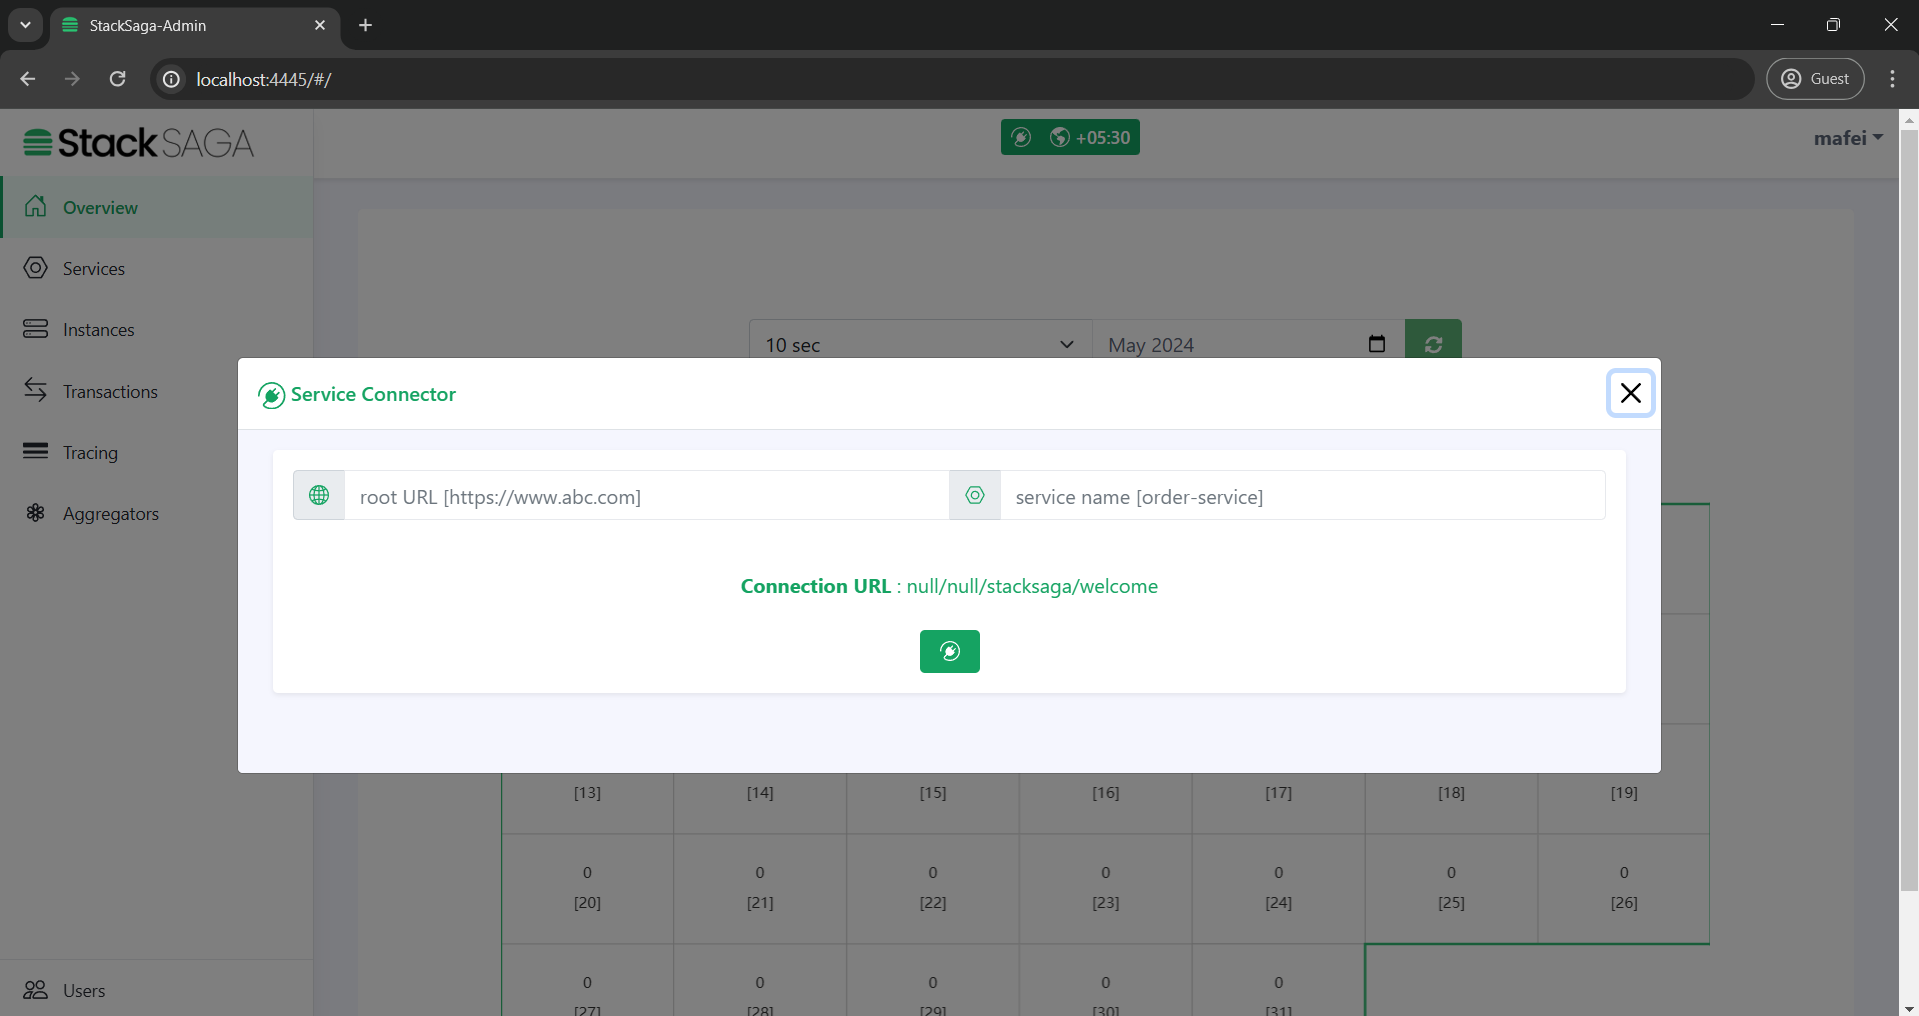
After that, you can enter the root URL of the target service is running on and enter the target service name or alias for your target service and submit like below. And then you can see a successful message if you have the authority to access the StackSaga endpoints.
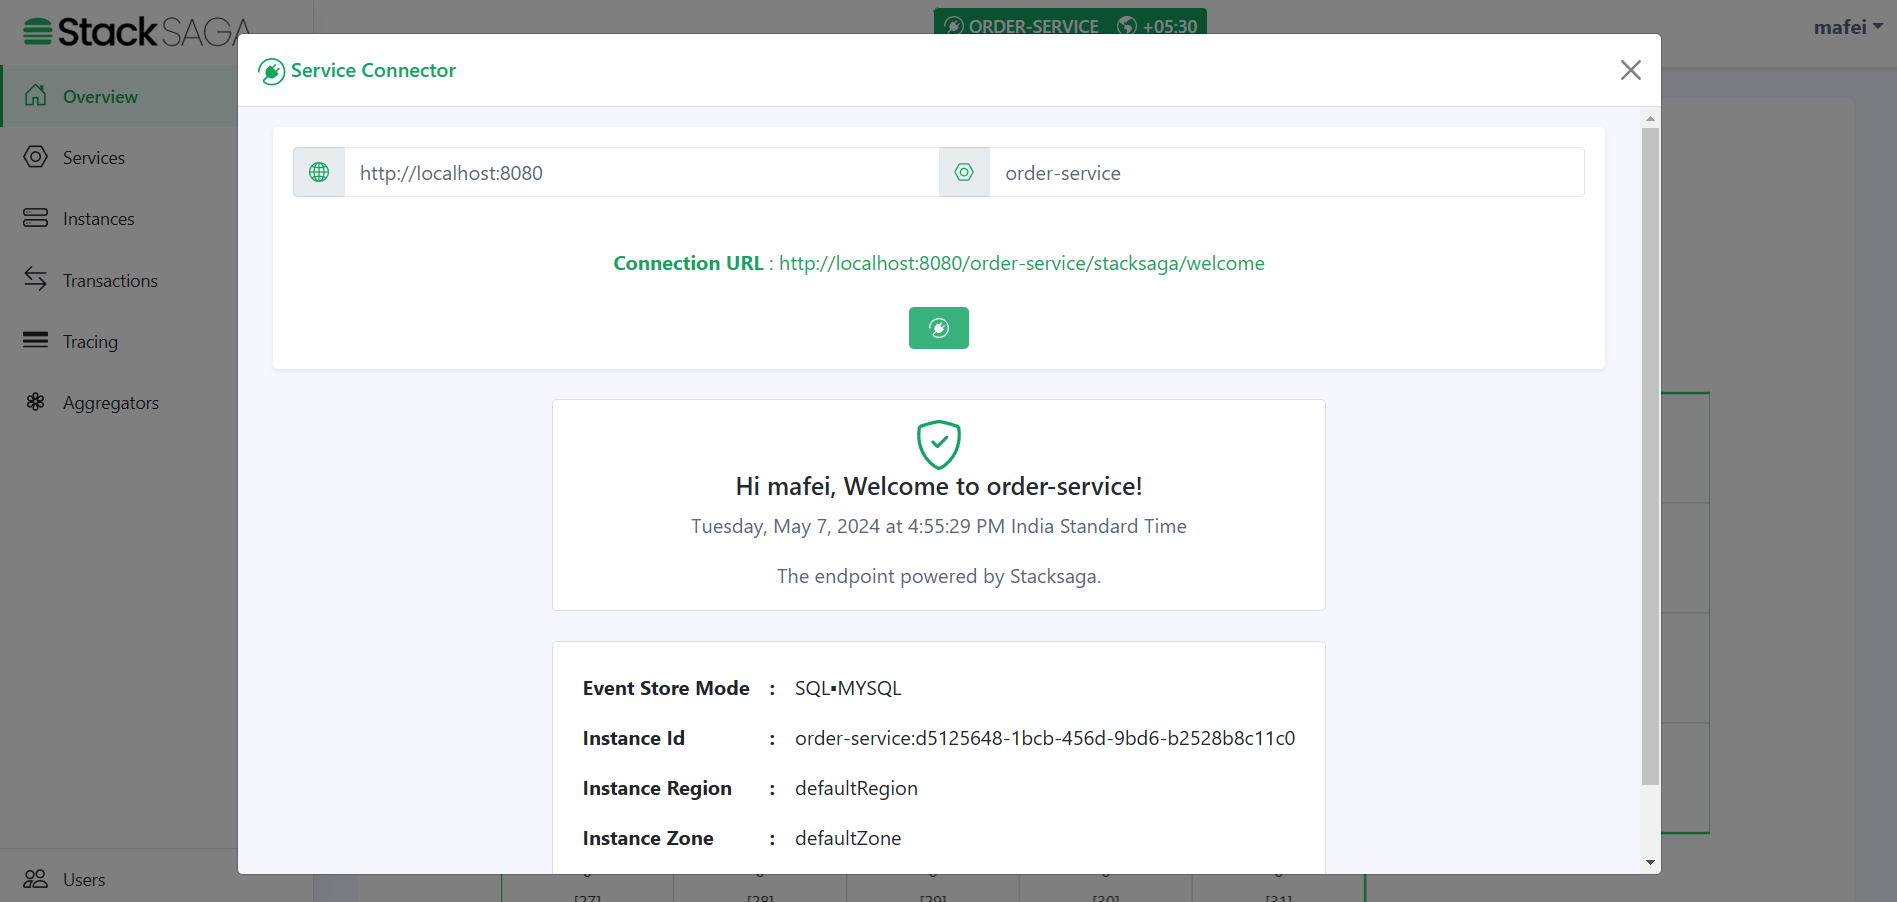
Or otherwise, you will have a 403 error like below.
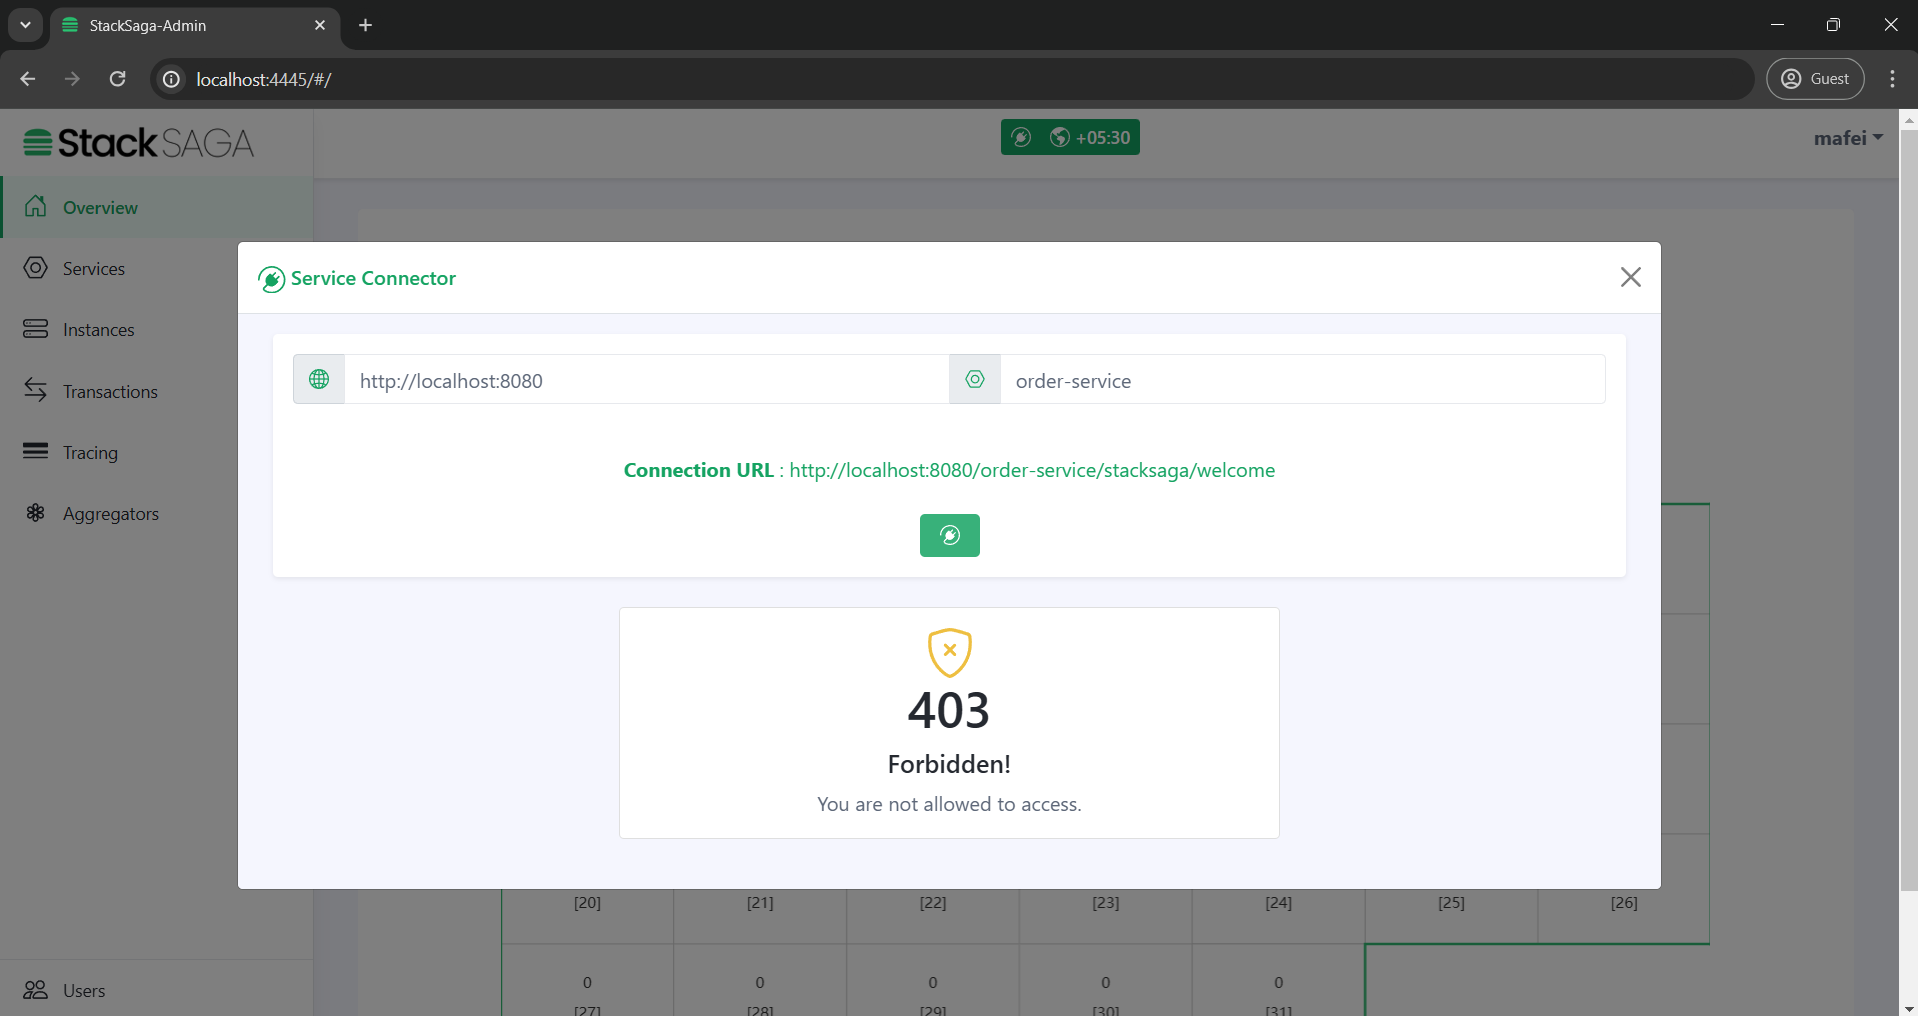
The /stacksaga/welcome endpoint is the endpoint for checking the credential.After checking the credentials, if the request is success that target service is saved as your current target service.If you want to switch to another service, again enter the target service name with root url and check the credentials.If the request is success it will be saved as the current target service.
|
If you add security in your application (for the Gateway or individual services), make sure to permit the url pattern start from /stacksaga/**.
StackSaga framework will take care of them.
|
How the endpoints are protected in with the Stacksaga Cloud-Window.
The following numbers correspond to the image.
| 1 | After successfully login to the system the user can provide the target URL and the target service (If you have an alis instead of service name, it should be provided).
|
||
| 2 | When the connect-button is clicked, the cross-border request goes to the target URL and the api gateway or any proxy server will navigate the request to one of the available instances of the target service with your user credentials that you logged to the admin dashboard. | ||
| 3 | The Proxy server forwards the request to one of the available target services. | ||
| 4 | After receiving the request in to the order service, all the requests are filtered by Stacksaga if the request has the /stacksaga/.. prefix.
If it contains, the request is caught by the Stacksaga framework and make a new request to the configured admin server with your credentials, and as we as the server’s credentials to verify both user and server has the authority to access the particular request. |
||
| 5 | Both user’s token and service-user credentials are validated. | ||
| 6 | If both credentials are valid, the Stacksaga framework grants the authority to access the event store through the Stacksaga endpoints. |
IF the request is failed due to some credential issue, tou are not able to access the data.